
docMgt provides users with several tools that drastically improve efficiency. In this 3-part series blog, Dashboard the first of the three most used efficiency enhancement tools will be covered. These three tools include: Dashboard, Workflow Manager, and Configuration Manager. We encourage our users to learn and use these three valuable tools that will immediately improve efficiency.
Dashboard
The dashboard feature is an administrative tool that allows administrators and reporting users to view certain statistical information such as the number of Records, Documents and Data elements in the system. It also shows the number of Users, Teams and Record Types, Logins and workflow information.
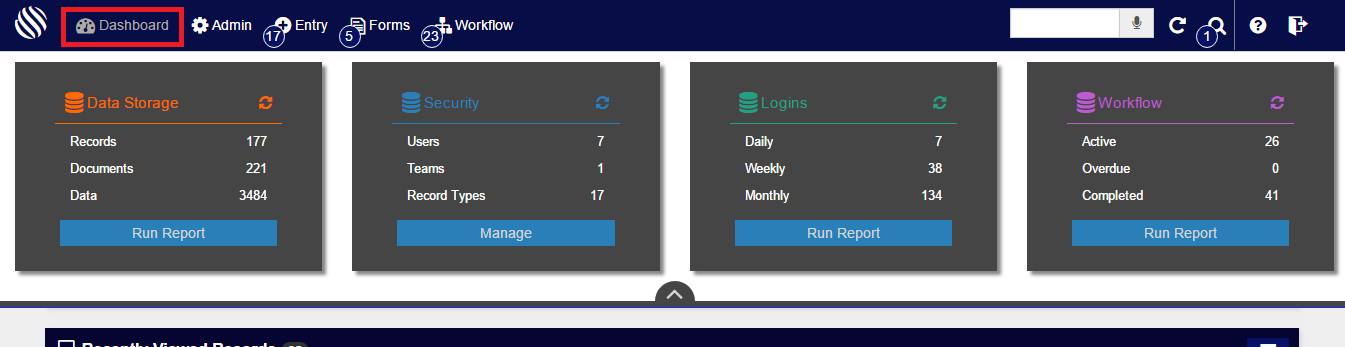
Click the [icon name=”tachometer” class=”” unprefixed_class=””] Dashboard button on the top toolbar to open the dashboard panel from any screen in the system. Click it again to hide the dashboard or use the up arrow on the bottom of the panel to hide it.
Data Storage
The Data Storage category shows you how much data is stored in the system at this time. It includes the number of Records, Documents and Data elements. Documents are fairly easy to understand but the Data elements are typically less understood. Each Record has data associated with it. If the Record represents an invoice then the data elements associated might include Invoice Number, Date, PO Number, Vendor, etc. There are almost always more Data elements than Records.
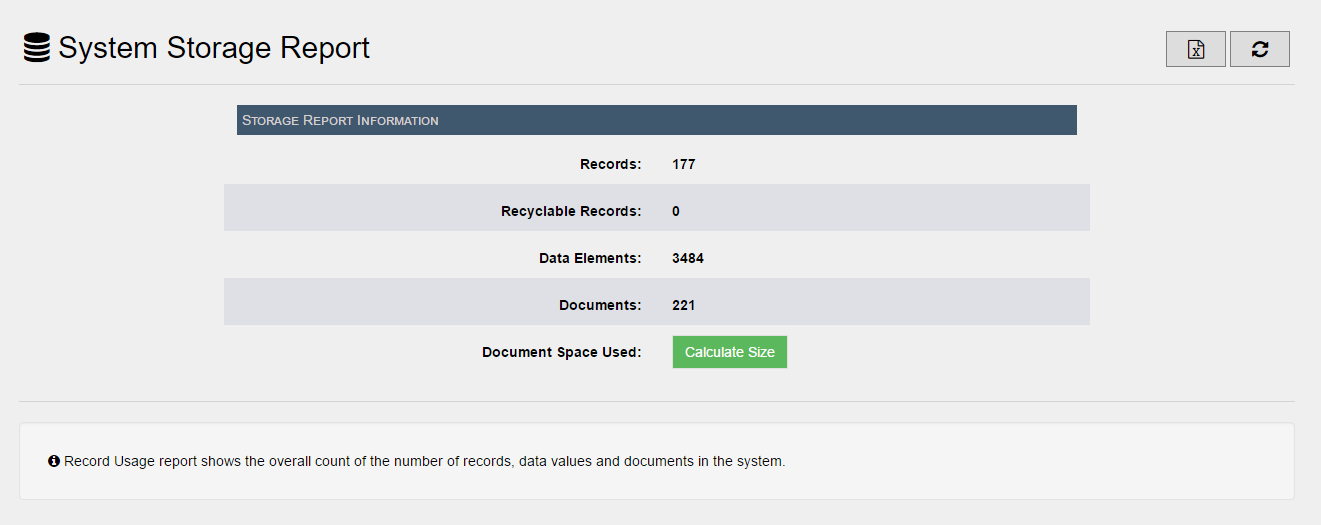
To view Document Space Used, press the Calculate Size button. Remember, this can take a few minutes on larger systems.
Security
The Security category shows a breakdown of how many Record Types, Users, Teams, and also IP Limits that are stored in the system. This is merely a quick reference of the items. Click on any of the items to open up the administration are for the given item. For instance, click on the Users item to open up the User list in the admin section and so on.
Click the Manage button for this category to open up the Security administration section which includes links to all security items in the system.
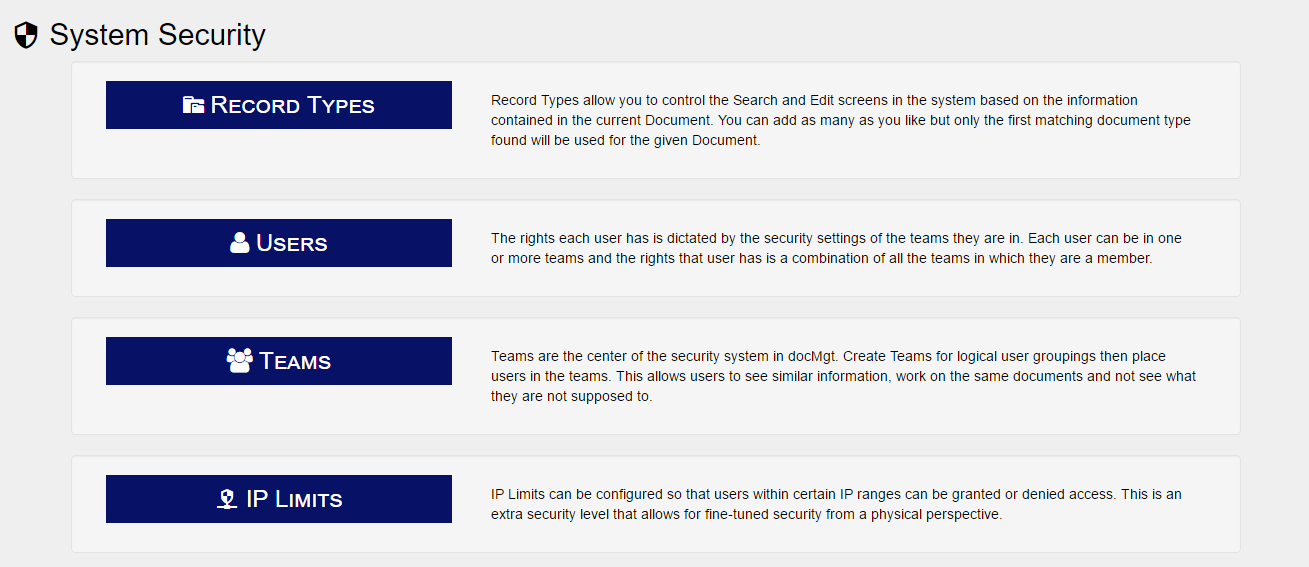
As mentioned, the Security category shows a simplistic breakdown of how many Record Types, Users, Teams, and also any IP Limits that are stored in the system. Select the appropriate button to view the breakdown.
Logins
The Logins category shows how many logins have happened in the last day, week and month. This is a good way to monitor usage and see if spikes are happening from time to time. Click on any of these items to run the Login Report for the given time period so you can see the details of who is logging in and from where.
Click the Run Report button from this category to run the Login report for the last 30 days.
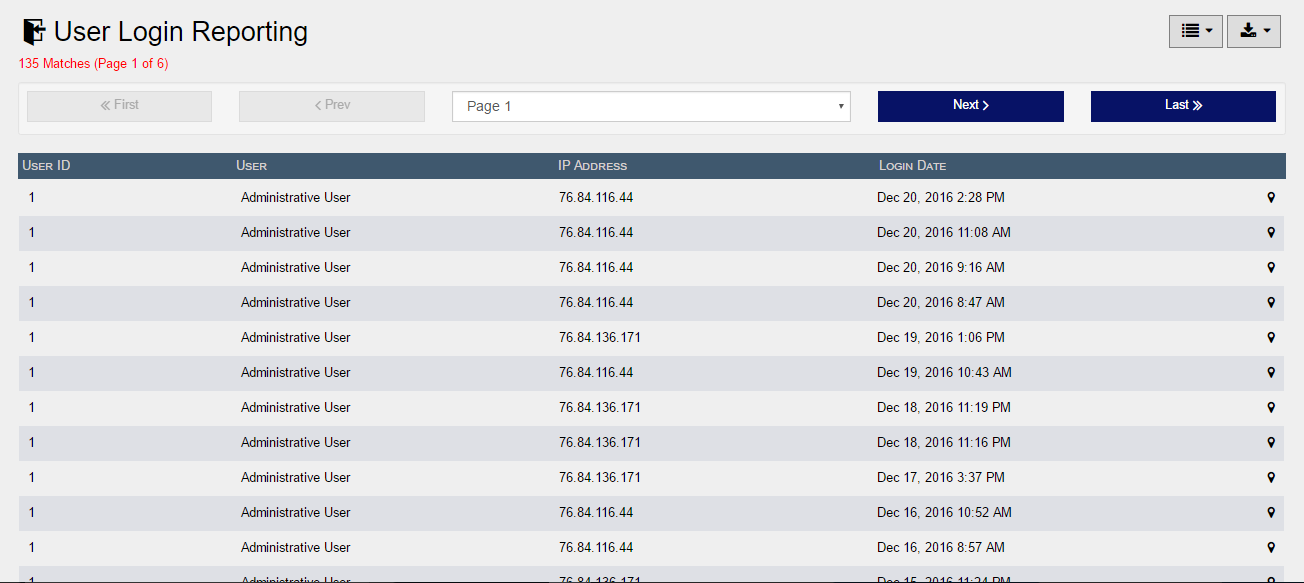
In the controls on the upper right hand, you are given the options to both view this information by 25, 50,or 100 logins per page. You may also, download the information into a CSV by it’s totality or on a per page basis. Finally, at the bottom of the page you are given the ability to search through these logins.
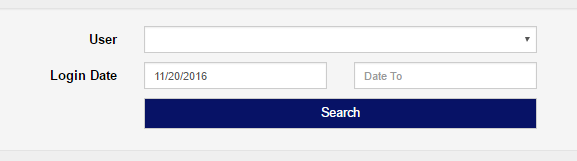
Enter the User name you’d like to find, or Login Dates that meet the desired timeline. Press the [icon name=”search” class=”” unprefixed_class=””] Search button to receive the results
Workflow
The Workflow category breaks down the number Workflow items currently active and overdue. It also shows those that have been completed in the past week. Clicking on the items will run their respective reports as you would expect.
Click the Run Report button from this category to run the Current Work Item report.
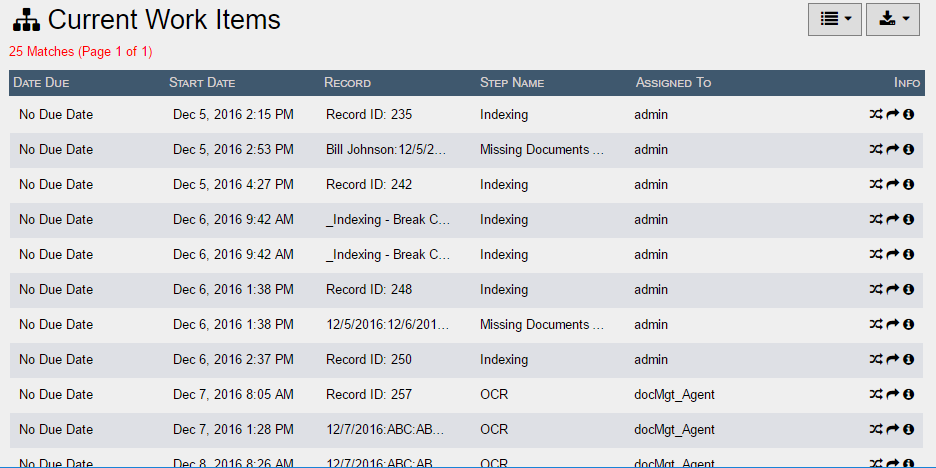
In the controls on the upper right hand, you are given the options to both view this information by 25, 50,or 100 workflows per page. You may also, download the information into a CSV by it’s totality or on a per page basis. Finally, at the bottom of the page you are given the ability to search through these workflows.
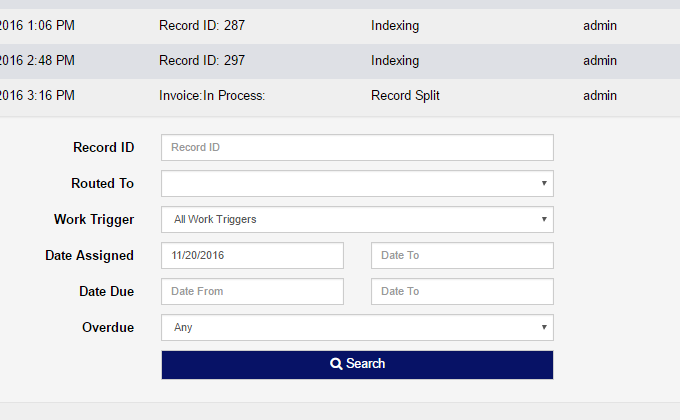
Enter the appropriate searches and select the [icon name=”search” class=”” unprefixed_class=””] Search button to view only the workflows you want to see.
Summary
The dashboard is a great feature that gives users a simplistic view into a number of system reports!