
The Problem With Raw Data
Collecting raw data and using it to make more informed decisions is central to the success of organizations today. Having a lot of raw data without a process to understand its critical data points, trends, and patterns often renders it useless. So, what are two things any organization can do to make sure they are taking full advantage of the data that is being collected through their systems? We believe you need to (1) visualize the data and (2) distribute the visualized data to the right people in a timely and consistent way. Both of which can be done with our new feature – Data Views.
Visualize The Data
Data visualization helps people understand the significance of their data by placing it in a visual context. Patterns, trends and correlations that might go undetected in text-based data can be exposed and recognized easier with visualization. One of the most significant benefits of visualization is that it allows visual access to huge amounts of data in easily-digestible visuals. Well-designed graphics are usually the simplest to understand and point you directly to the significance of the data.
Within docMgt we have developed a new feature called “Data Views”. With Data Views, users can perform a search from their data and then click a Data View to see the searched data in a visual, chart format. The user can also see a tabular view of the data that makes up the chart. Searches that are significant to your role or to the organization overall can be configured and saved. An example might be a daily report of outstanding invoices over $5000.00 that are overdue by more than 30 days or in a car dealership the number of test drives by salesperson over the last 7 days.
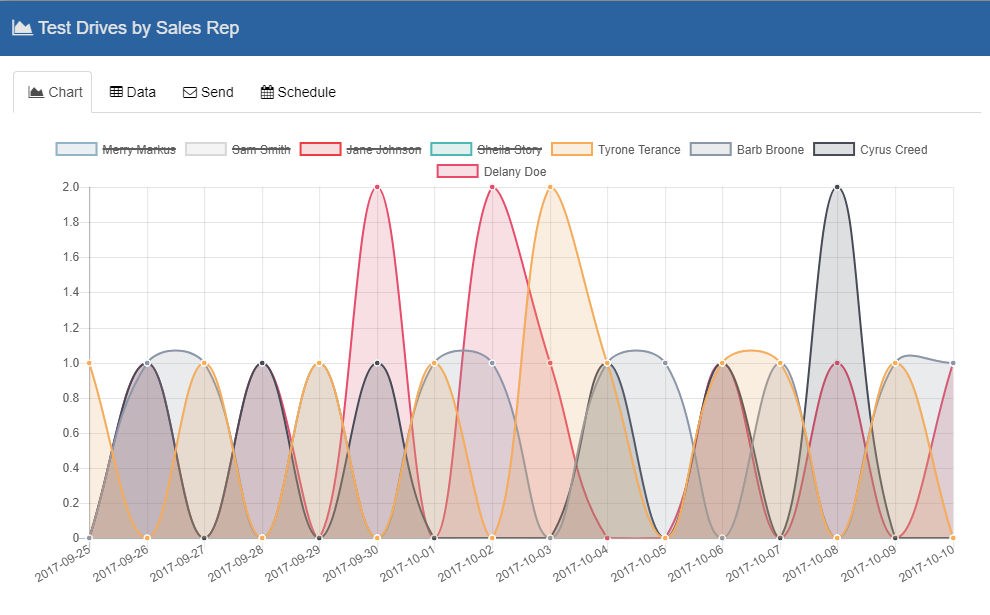
Sample Data View
Distribute The Data
These data views can then be emailed so the information that is summarized with the chart can be shared or saved easily. These emails can also be scheduled so users can receive Data Views automatically directly in their inbox. This is a great way for managers to be able to keep up to date with mission critical information without needing to log in and run reports manually. Simplifying and automating the way data is presented and distributed maximizes the value of the data. Users are also better prepared to use it to make informed decisions to help improve operations.
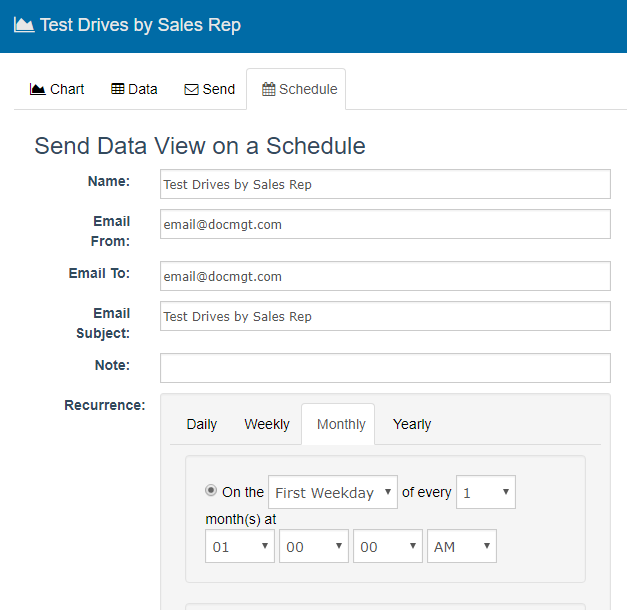
Sample Data View Schedule
Summary
Data Views provide that crucial view of your raw data that had previously been missing. We believe this feature will add to the value and usefulness of any docMgt system. Contact us today to see a demonstration of the power of Data Views!